背景
在对某抽奖压测服务时(dev&test环境),发现当 QPS 达到 100 左右时,CPU 使用率就达到 100%,对应的 on-CPU 火焰图显示,有接近 56% 的 CPU 时间在进行 Deoptimization:
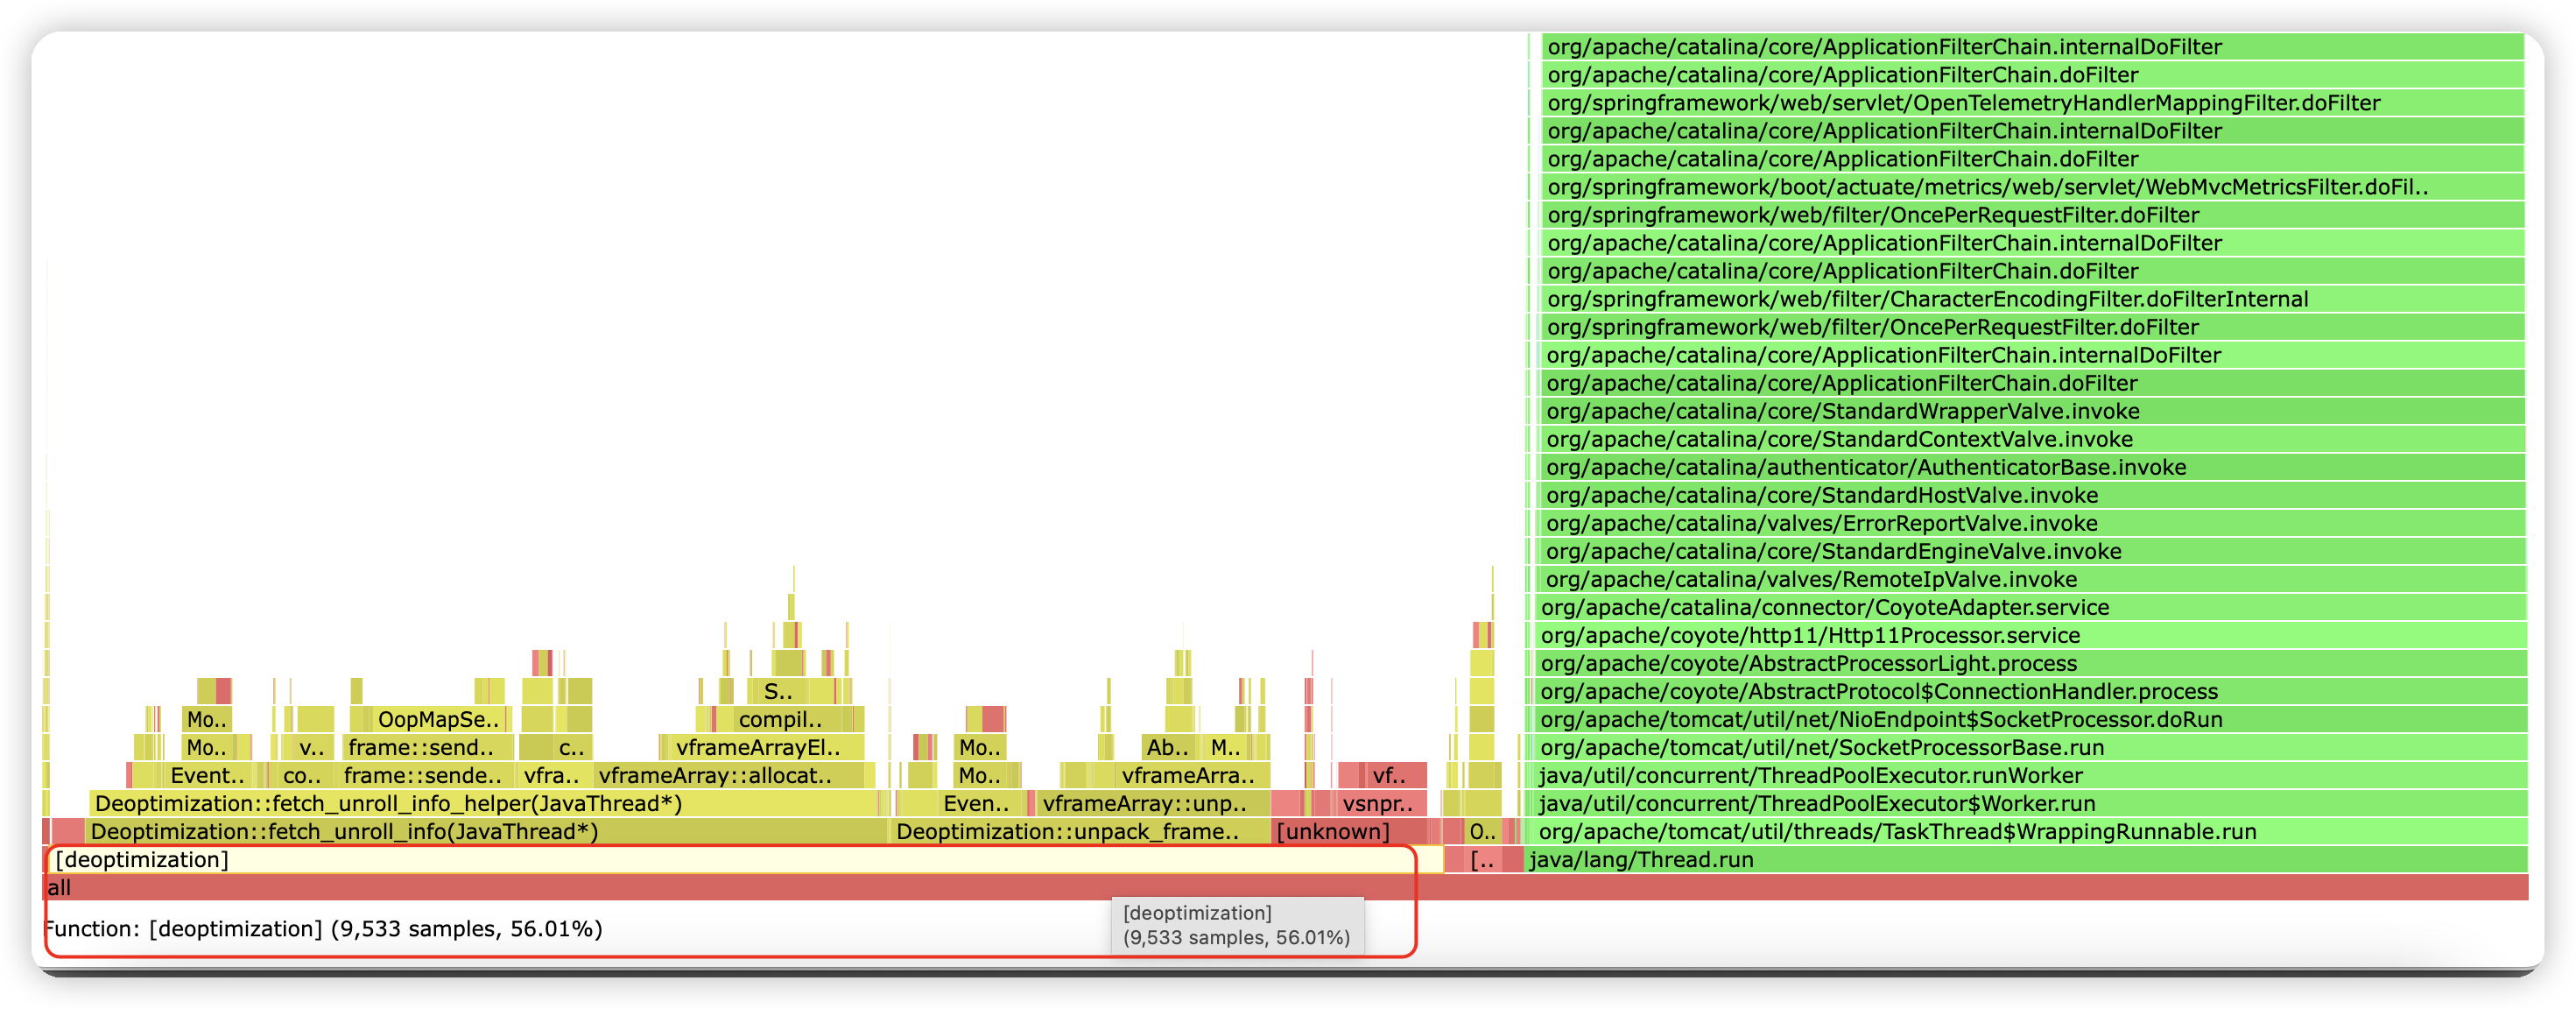
经调研,怀疑是该 JDK Bug 导致:https://bugs.openjdk.org/browse/JDK-8243615
类似的反馈还有:
复现方法
测试代码:
 1
 2
 3
 4
 5
 6
 7
 8
 9
10
11
12
13
14
15
16
17
18
19
20
21
22
23
24
25
26
27
28
29
30
31
32
33
34
35
36
37
38
39
40
|
public class UnstableIfTest {
    static int compute(double x)
    {
        return (int) (Math.sin(x) + Math.cos(x));
    }
    static void hotMethod(int iteration)
    {
        if (iteration < 20) {
            compute(78.3);
        }
        else if (iteration < 40) {
            compute(78.3);
        }
        else if (iteration < 60) {
            compute(78.3);
        }
        else if (iteration < 80) {
            compute(78.3);
        } else if (iteration < 100) {
            compute(78.3);
        } else {
            compute(78.3);
        }
    }
    static void hotMethodWrapper(int iteration)
    {
        int count = 100_000;
        for (int i = 0; i < count; i++) {
            hotMethod(iteration);
        }
    }
    public static void main(String[] args)
    {
        for (int k = 0; k < 1000; k++) {
            long start = System.nanoTime();
            hotMethodWrapper(k + 1);
            System.out.println("iteration " + k + ": " + (System.nanoTime() - start) / 1_000_000 + "ms");
        }
    }
}
|
执行步骤:
1
2
3
4
5
6
7
8
|
# Step1: 编译代码
javac UnstableIfTest.java

# Step2:执行代码
java -XX:PerMethodRecompilationCutoff=4 UnstableIfTest

# Step3:在代码执行期间,使用 arthas 或者 async-profiler 收集火焰图
profiler start -e cpu -d 120
|
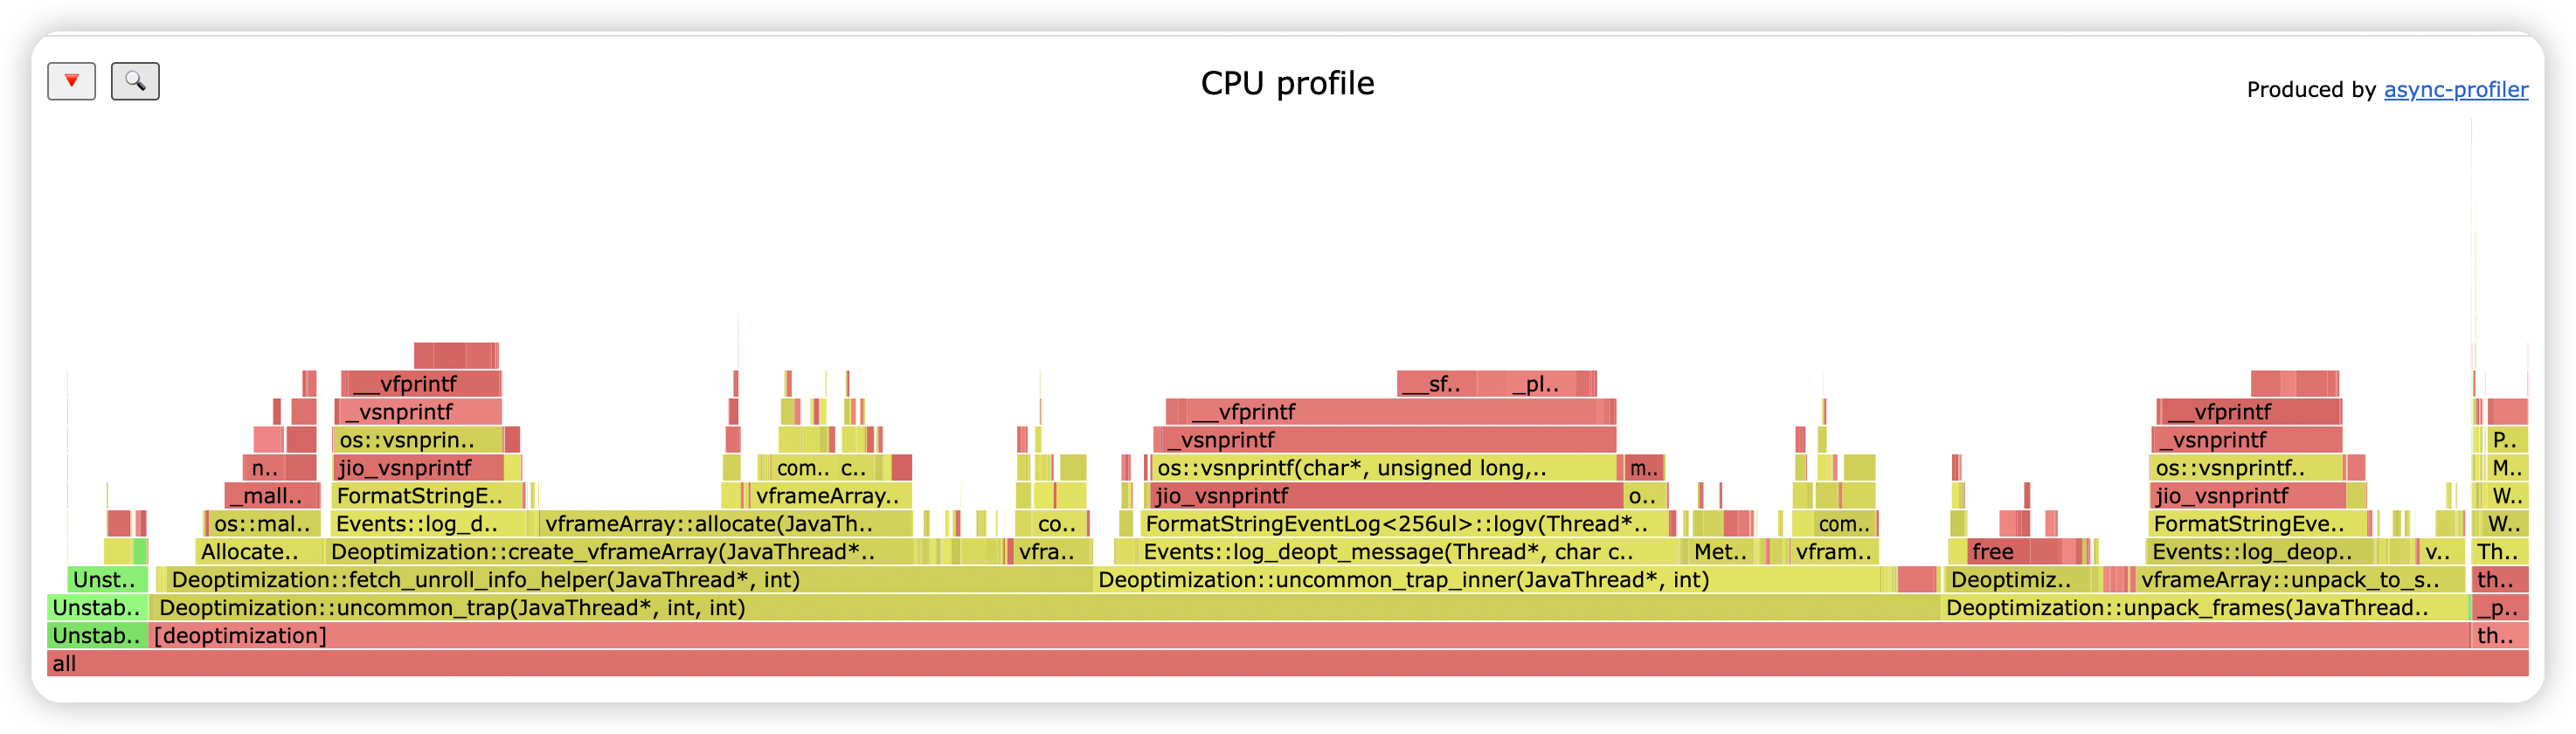
结果:
试分析原因
实验
注: 这里需要使用 java21,因为之前的版本还不支持打印 deoptimization 日志。
1
2
3
4
5
6
7
8
9
|
# 使用 java21 执行一下命令
java -XX:+UnlockDiagnosticVMOptions -XX:PerMethodRecompilationCutoff=4 -Xlog:deoptimization=debug UnstableIfTest > log.txt

# 大量 deoptimization 日志
[18.896s][debug][deoptimization] cid= 632     level=4 UnstableIfTest.hotMethod(I)V trap_bci=67 unstable_if none pc=0x0000000113084938 relative_pc=0x0000000000000138
[18.896s][debug][deoptimization] cid= 632     level=4 UnstableIfTest.hotMethod(I)V trap_bci=67 unstable_if none pc=0x0000000113084938 relative_pc=0x0000000000000138
[18.896s][debug][deoptimization] cid= 632     level=4 UnstableIfTest.hotMethod(I)V trap_bci=67 unstable_if none pc=0x0000000113084938 relative_pc=0x0000000000000138
[18.896s][debug][deoptimization] cid= 632     level=4 UnstableIfTest.hotMethod(I)V trap_bci=67 unstable_if none pc=0x0000000113084938 relative_pc=0x0000000000000138
....
|
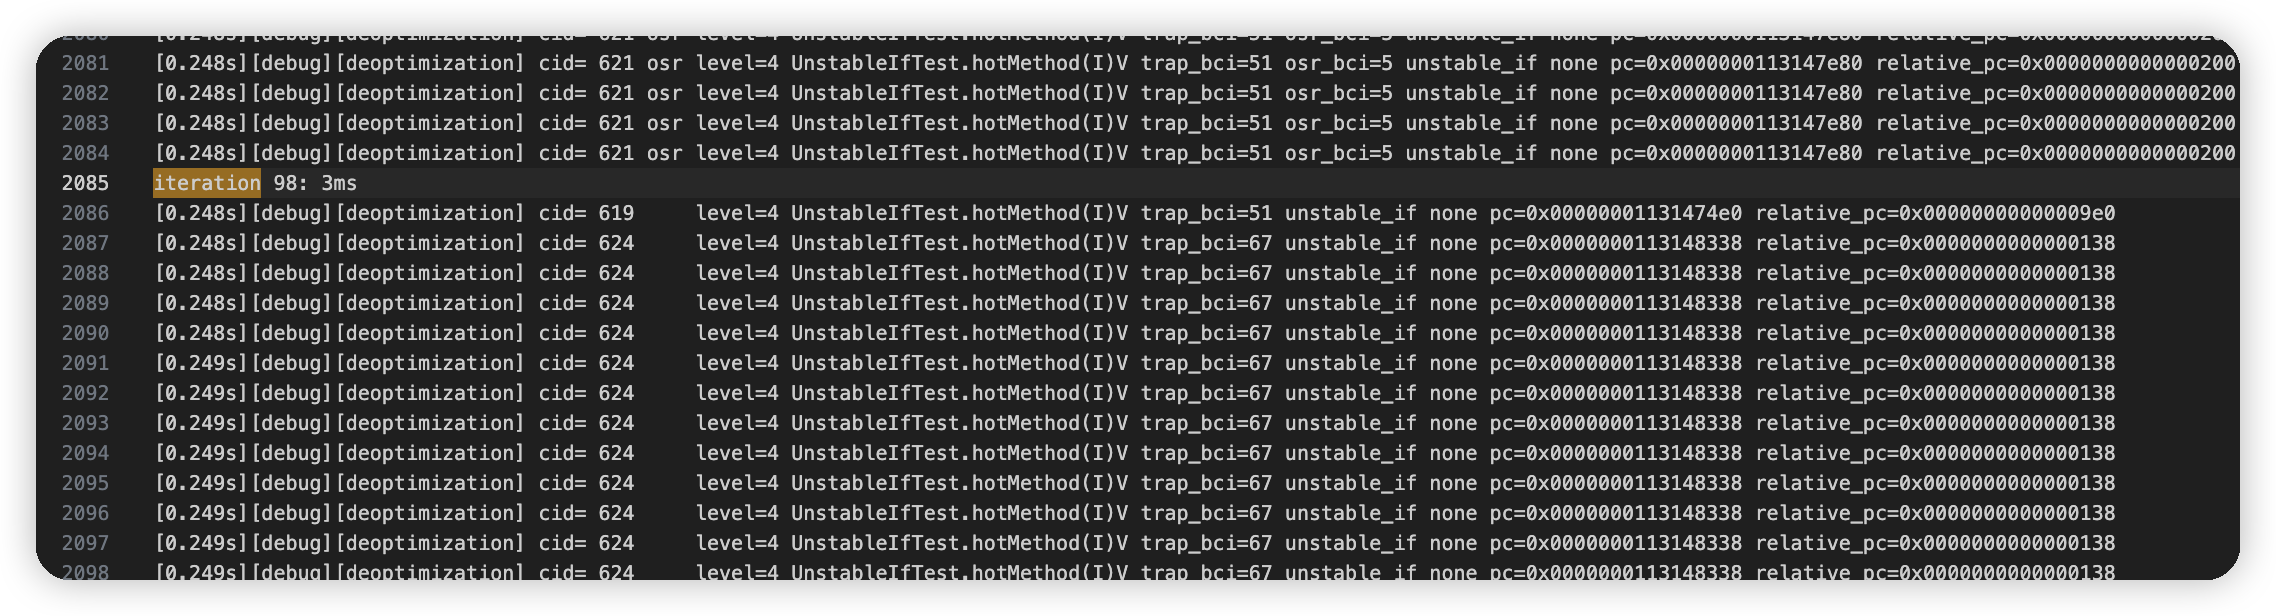
第 98 次迭代耗时只有 3ms:
 第 99 次迭代,耗时 631ms:
(注意在第 98 次迭代时,cid=621 osr,到第 99 次迭代时,cid=624)
第 99 次迭代,耗时 631ms:
(注意在第 98 次迭代时,cid=621 osr,到第 99 次迭代时,cid=624)
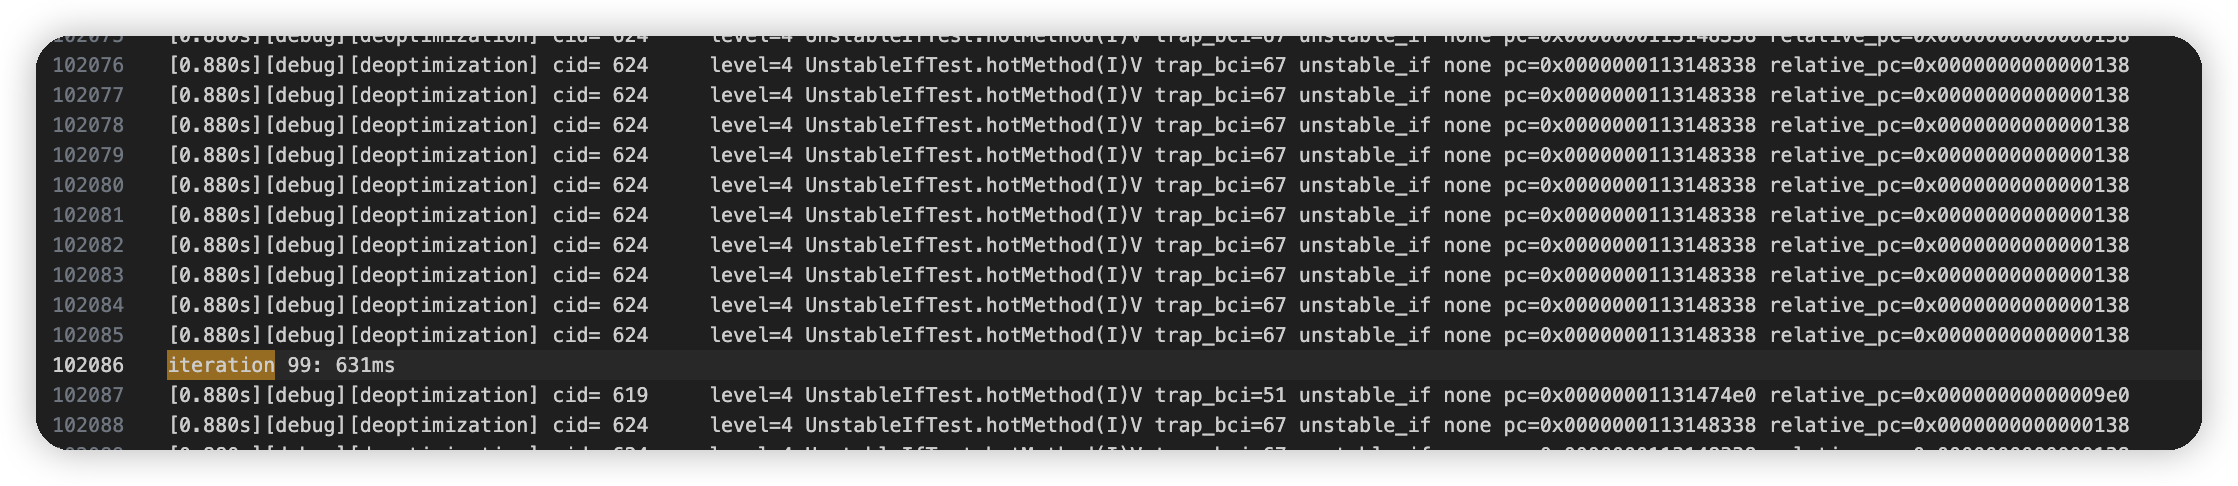
在两次迭代直接,总共打印了 10万次(102086-2086=100000) deoptimization 日志,这正好是方法 hotMethodWrapper 内部循环的次数:
1
2
3
4
5
6
7
|
static void hotMethodWrapper(int iteration)
{
    int count = 100_000;
    for (int i = 0; i < count; i++) {
        hotMethod(iteration);
    }
}
|