背景
某 Java 服务的老年代内存占用持续高位,怀疑可能存在内存泄漏的风险。
排查记录
分析堆内存 dump
dump&&分析
jmap -dump:[live],format=b,file=<file-path> <pid>live: if set, it only prints objects which have active references and discards the ones that are ready to be garbage collected. This parameter is optional.format=b: specifies that the dump file will be in binary format. If not set, the result is the same.file: the file where the dump will be written topid: id of the Java process
1、不进行 FullGC 直接 dump 内存
|
|
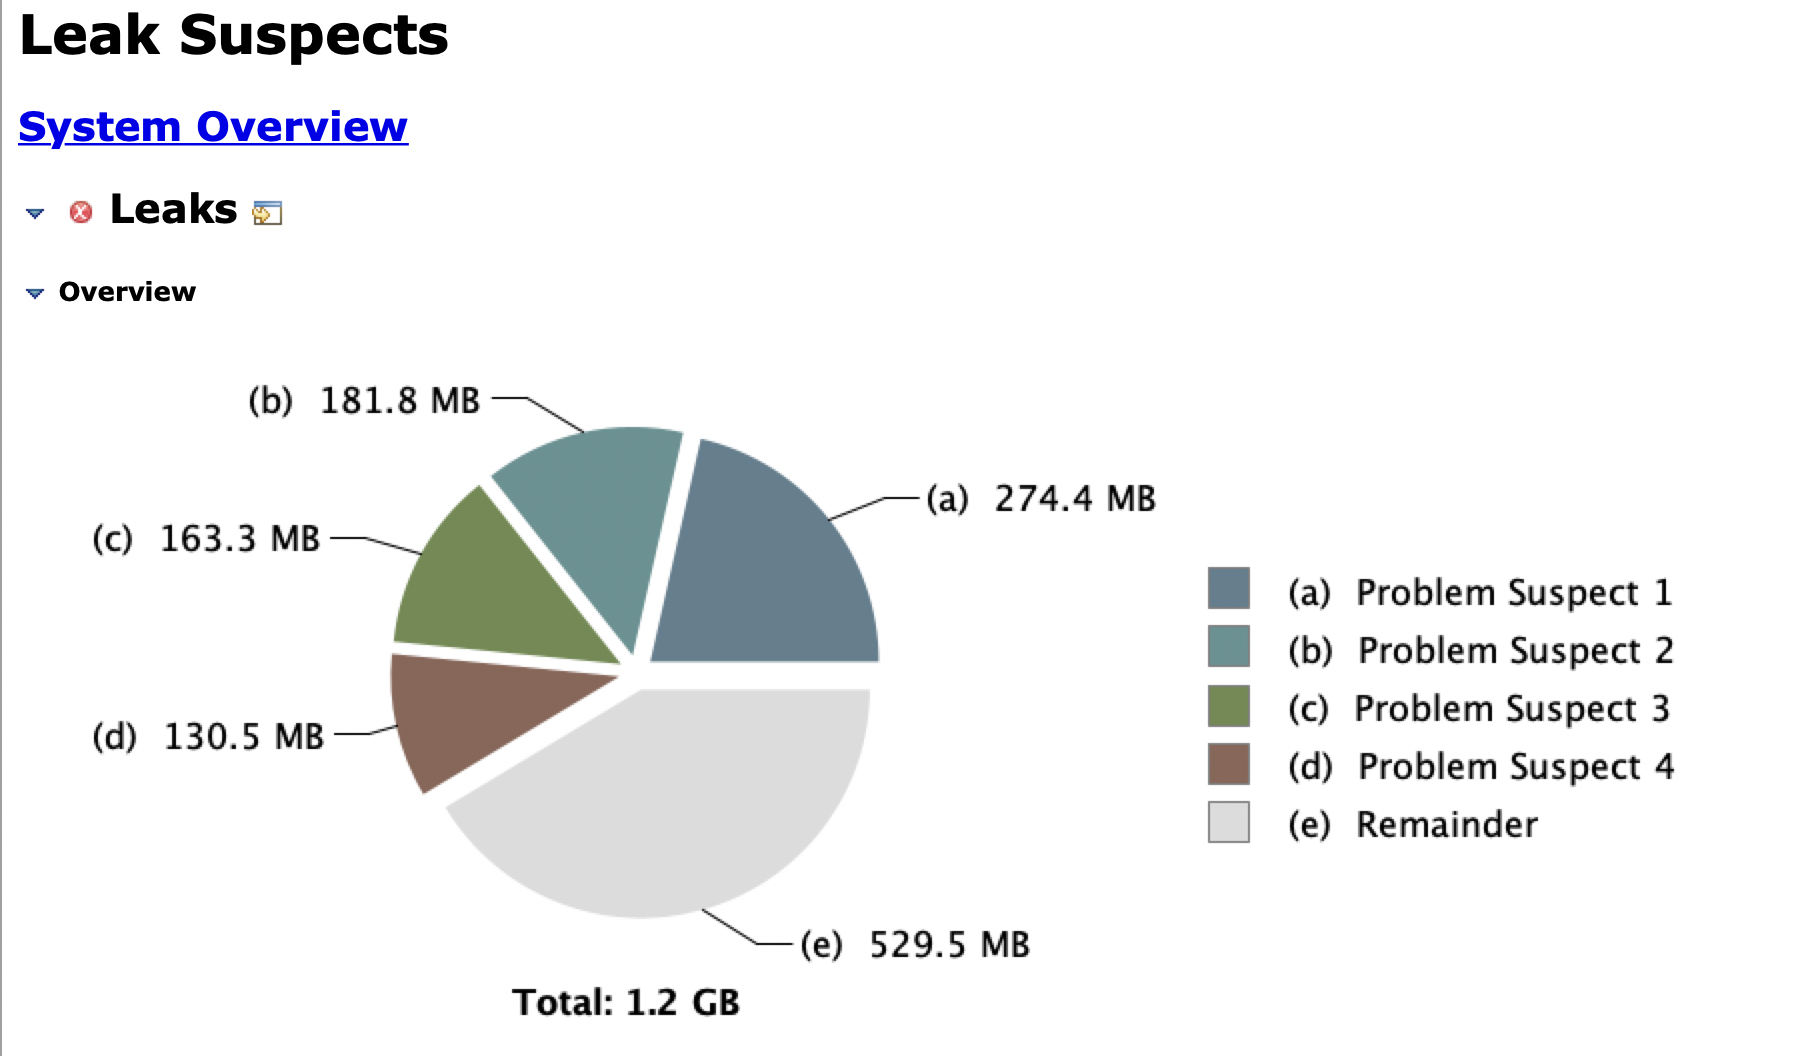
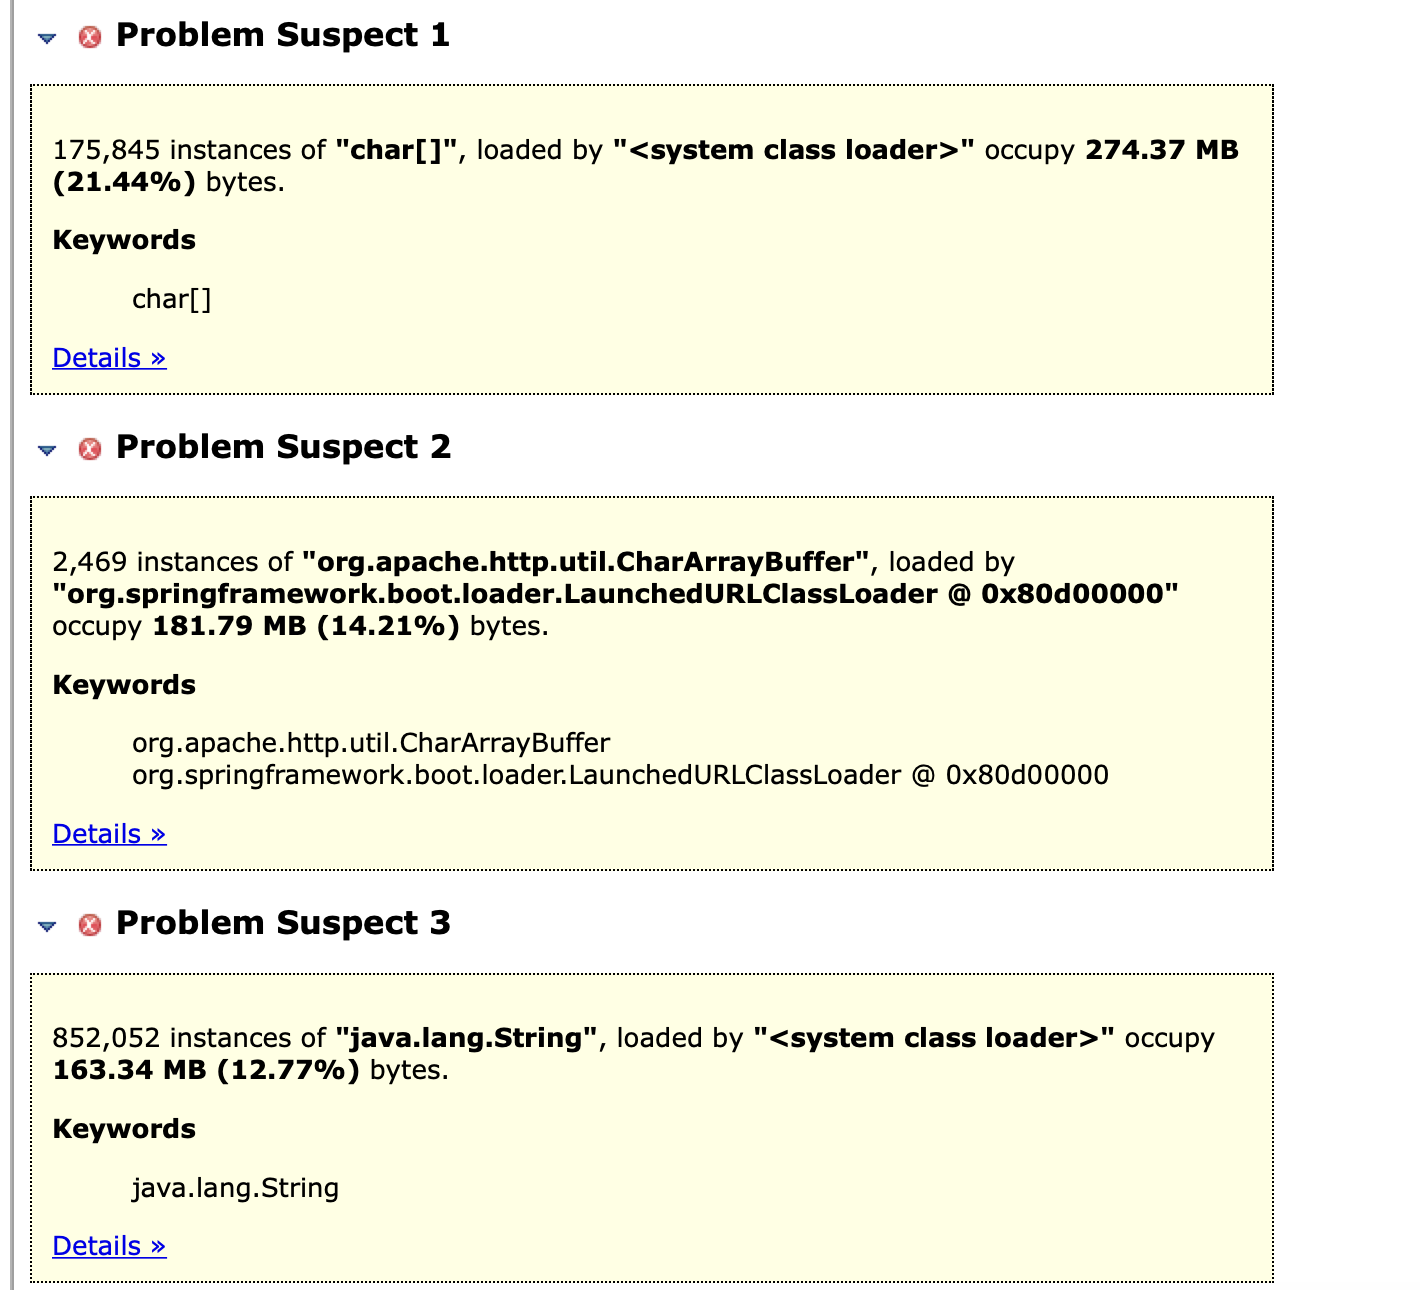
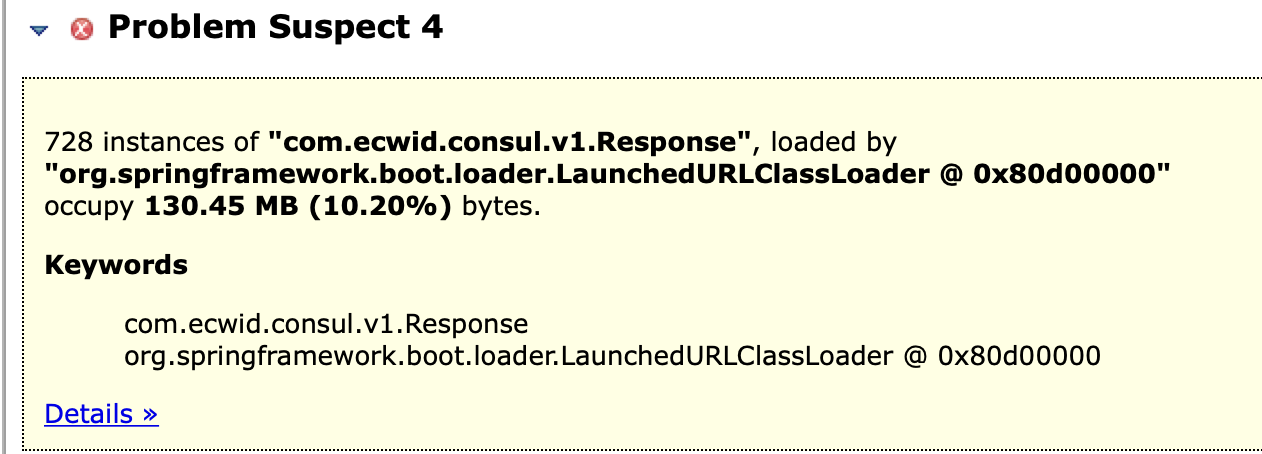
Leak Suspects 显示主要疑点全部与 com.ecwid.consul.v1.Response 有关。
2、强制 FullGC 然后 dump 内存 依次执行以下命令,获取内存 dump 然后进行压缩(提高文件下载速度),然后通过服务治理平台-文件下载功能下载到本地,使用 eclipse mat 或者 VisualVM 进行分析。
|
|
结论
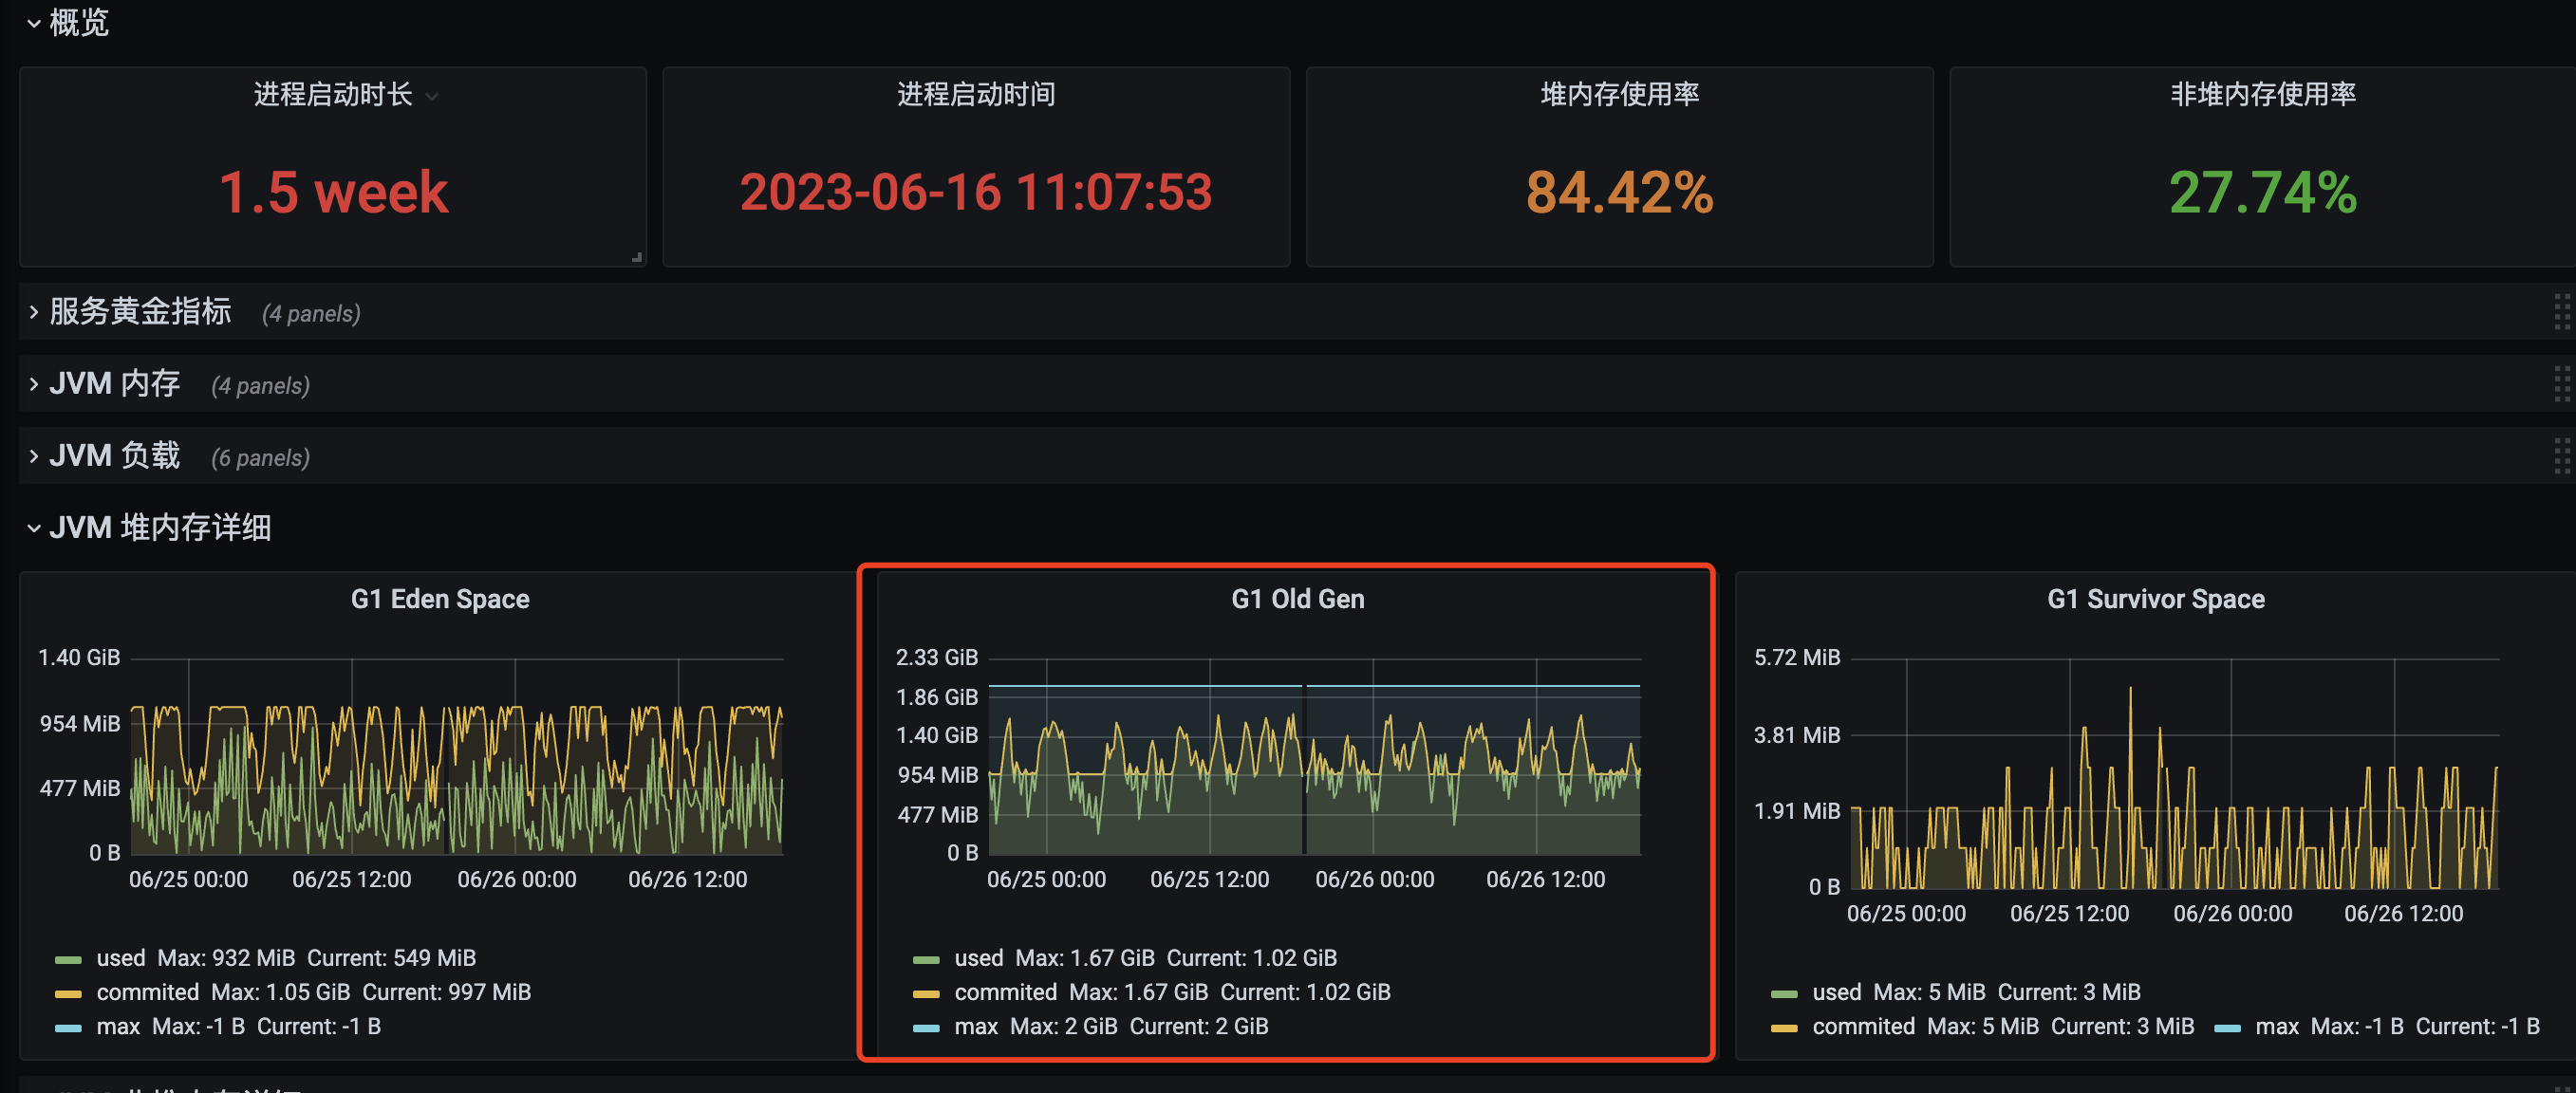
- Old Gen 虽然会达到很高占比,但总是能最终下降到低位,说明不存在严格意义上的内存泄露;
- 根据 Leak Suspects 报告,Old Gen 占用高主要是类 com.ecwid.consul.v1.Response 导致,它代表从 consul 拉取的数据,包括两类;
- CustomConfigWatch(javakit)获取的数据大小约 2MB;
- ConsulCatalogWatch(SpringBoot)获取的数据大小约 170KB;
- 这些数据会导致产生 Humongous 对象:比如网络层面接收这些数据时需要分配大的 byte 数组,转为 HttpResponse 时分配 char 数组(CharArrayBuffer);
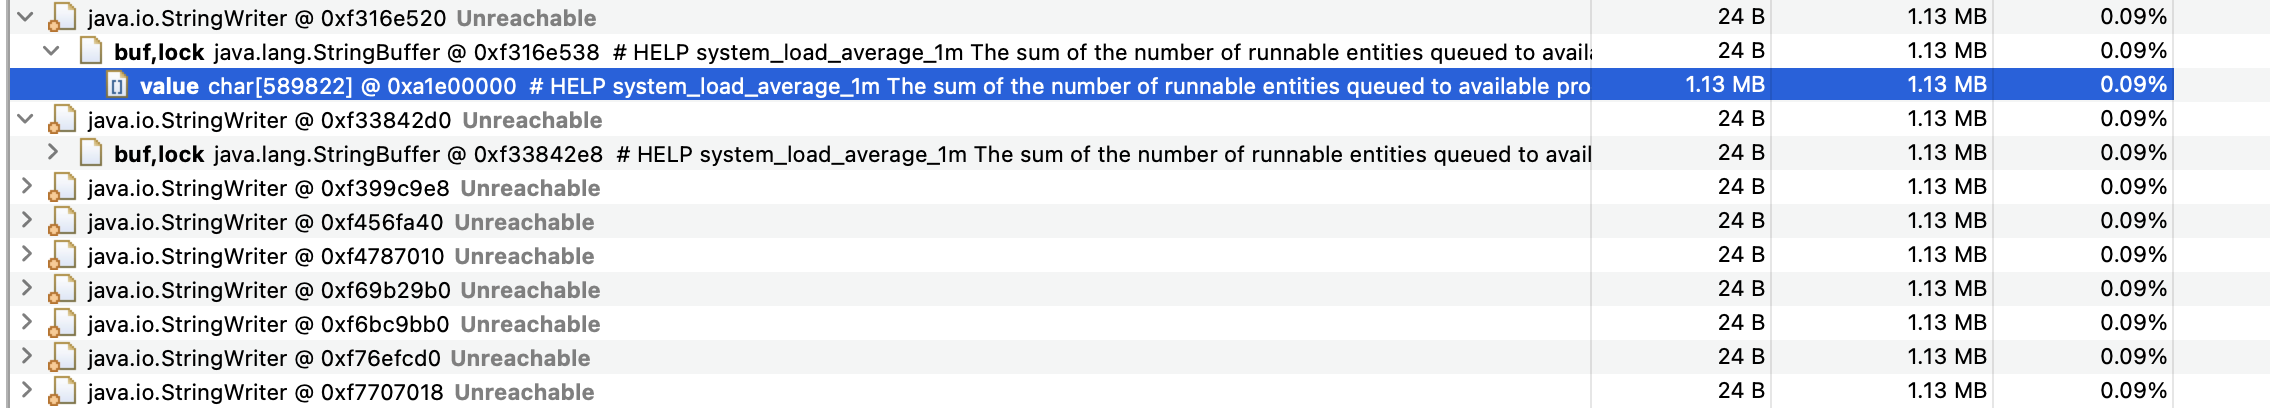
- 根据 Dominator Tree,除了 consul 数据,监控数据占内存同样很高
分析 GC 日志
结论
- Old Gen 占比高并不是因为长生命周期对象晋升,而是大量分配 Humongous 对象(简称 H-Obj)—-因为根据监控,在没有 GC 时,Old Gen 的却一直在增长;
- 每当进行 H-obj 分配时,就会触发 Mixed GC 的并发标记循环,进而导致一次 YGC(inital mark),回收死亡的 H-Obj;但如果当前处于 Mixed GC 阶段,则不会再触发一次;
- 由于 H-obj 的分配频率非常高,因此实际会一直处于 Mixed GC 阶段(中间可以夹杂多次 YGC);
- 在 YGC 以及 Mixed GC 的 cleanup 阶段,Old Gen 会大幅下降,因为此阶段会对 H-Obj 对象进行清理;
- 虽然强制指定 -Xmn1g,但实际 Young 区还是会缩小;
- dev & test 环境,在出现如下 GC 日志时,Old Gen 只有小幅下降:
|
|
整体结论
- Old Gen 的快速上升主要是由于大量的 H-obj 分配,大对象的来源按频率排序,目前主要有 3 个:
- ConsulCatalogWatch(SpringBoot)获取的数据大小约 170KB,约每 2 秒一次;
- CustomConfigWatch(javakit)获取的数据大小约 2MB,约每 27 秒一次;
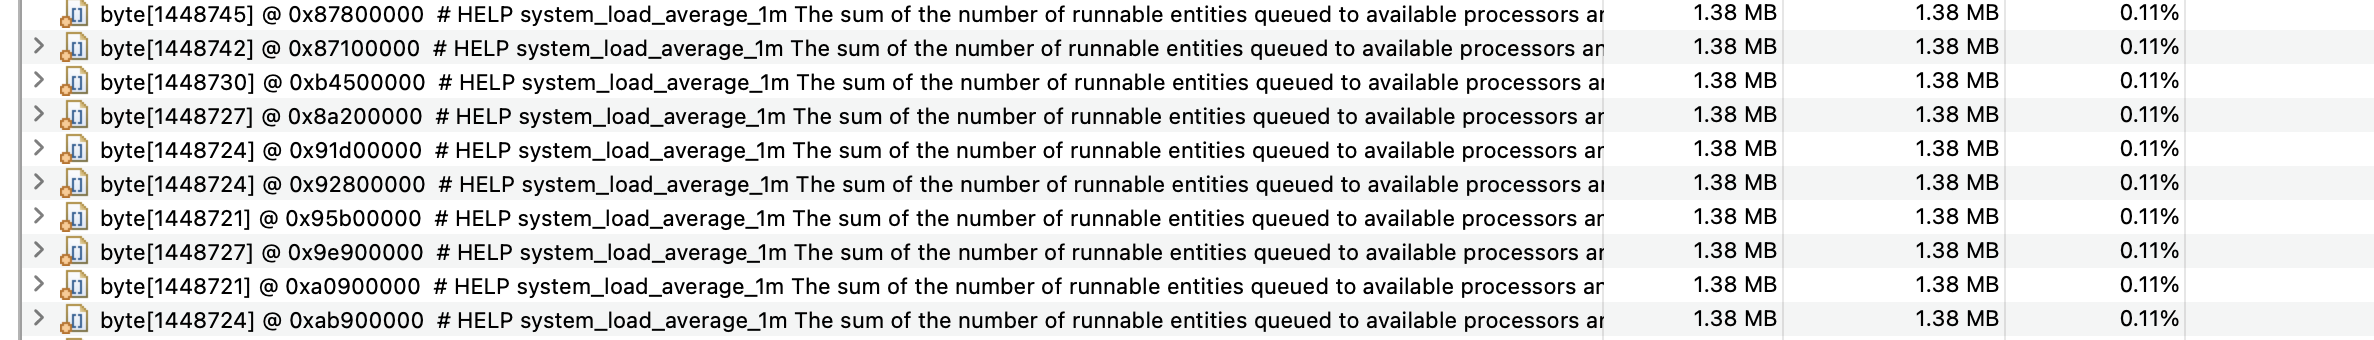
- Prometheus&Metrics 监控数据,小于等于 1.3 MB,约 1 分钟一次??
- H-obj 的分配速率与年轻代对象的增长速率大约成正比,且往往小于年轻代的增长速率;
- 但存在一些特殊情况,在 mixed 回收阶段,由于 Old Gen 中可回收的 region 大于 5% 阈值,需要触发混合回收;且根据预测,可以留给 Old Gen 的回收时间非常短(不足 1ms),导致选择选择 CSet 时 Old Gen region 特别少,剩余 region 仍然大于 5%阈值,因此 mixed 阶段将持续,然后恶性循环(最多 8 次 mixed gc);中间如果出发 YGC,则 humongous 对象会被清除,Old Gen 占用会大幅下降(真正的老年代对象并不会清除);
- 问题在于预测时间为什么会这么短?
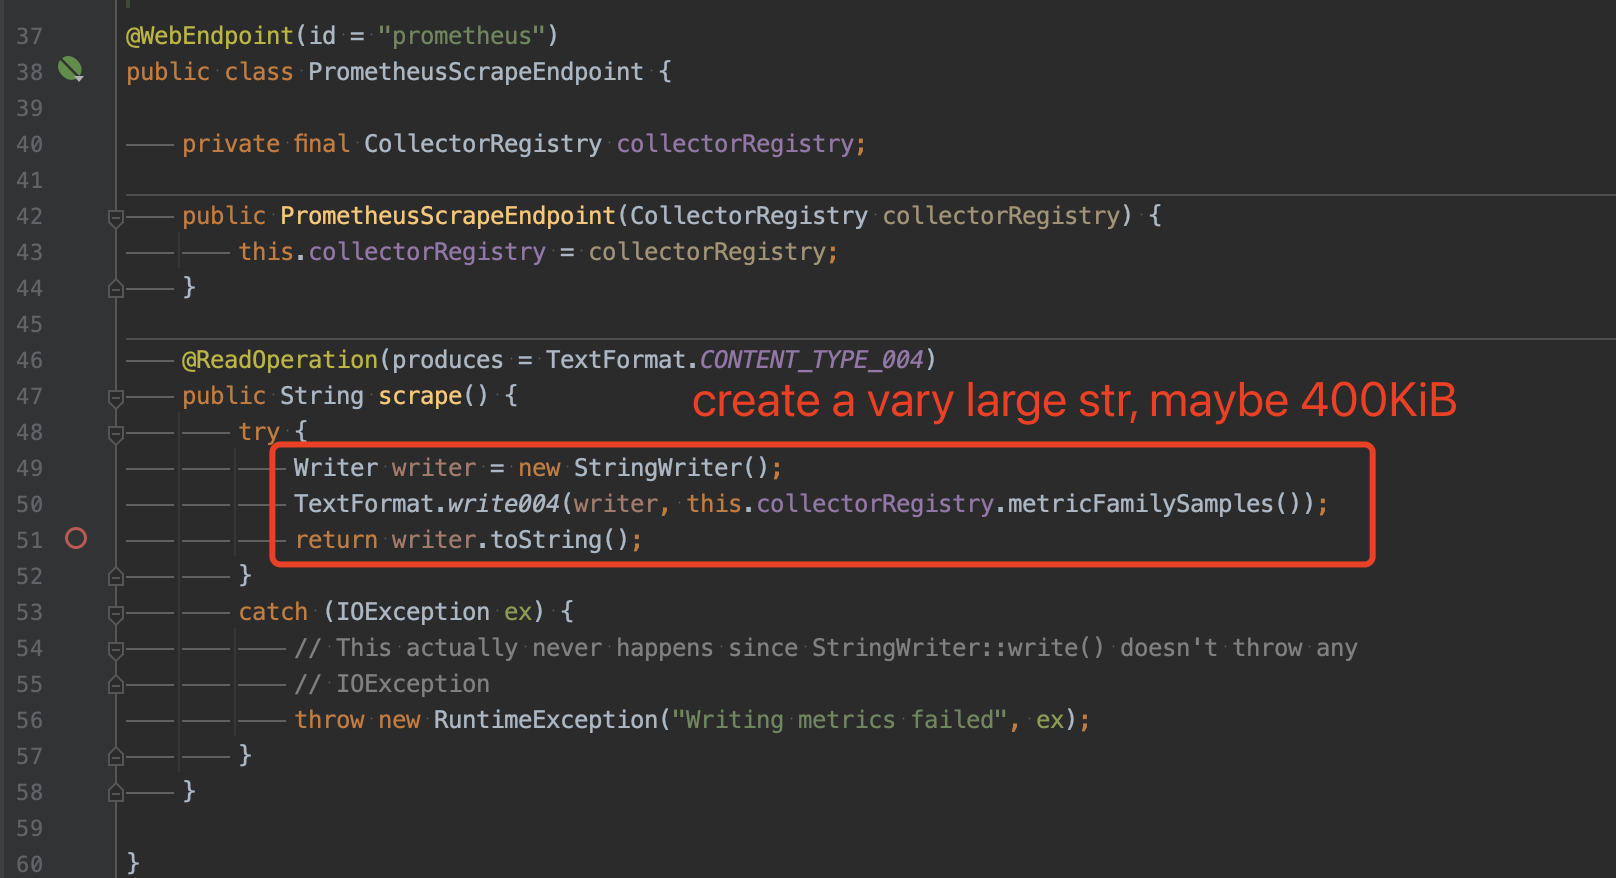
优化方案
优化 PrometheusScrapeEndpoint
相关讨论:
- StringHttpMessageConverter may trigger humongous allocations (G1GC) #25645
- Add support for streaming responses from actuator web endpoints #21308
思路?
- 使用一个 char[] 内存池,scrape 时从内存池获取一个足够大的 char 数组用于生成数据,完成后,将数组归还内存池?
- 减少 tag 数量?