PromQL
参考:https://blog.csdn.net/han949417140/article/details/113513227
官网:https://prometheus.io/docs/prometheus/latest/querying/basics/
- https://grafana.com/docs/grafana/v7.5/panels/queries/
- https://prometheus.fuckcloudnative.io/di-san-zhang-prometheus/di-4-jie-cha-xun/basics
- https://github.com/google/re2/wiki/Syntax
基本概念
- 时间序列(time-series)
    - 样本
        - time-series 是按照时间戳和值的序列顺序存放的,我们称之为向量(vector)
            - 每条 time-series 通过指标名称(metrics name)和一组标签集(labelset)命名
        - 在time-series中的每一个点称为一个样本(sample),样本由以下三部分组成:
            - 指标(metric):metric name和描述当前样本特征的labelsets;
            - 时间戳(timestamp):一个精确到毫秒的时间戳;
            - 样本值(value): 一个float64的浮点型数据表示当前样本的值。
    - 指标(Metric)
        - 在形式上,所有的指标(Metric)都通过如下格式标示:
            - <metric name>{<label name>=<label value>, ...}
                - 指标的名称(metric name)可以反映被监控样本的含义(比如,http_request_total - 表示当前系统接收到的HTTP请求总量)
                - 标签(label)反映了当前样本的特征维度,通过这些维度Prometheus可以对样本数据进行过滤,聚合等
        - 以__作为前缀的标签,是系统保留的关键字,只能在系统内部使用
- Metrics类型
    - Prometheus定义了4种不同的指标类型(metric type):Counter(计数器)、Gauge(仪表盘)、Histogram(直方图)、Summary(摘要)
    - Counter:只增不减的计数器
        - Counter类型的指标其工作方式和计数器一样,只增不减(除非系统发生重置)。
        - 常见的监控指标,如http_requests_total,node_cpu都是Counter类型的监控指标。 一般在定义Counter类型指标的名称时推荐使用_total作为后缀。
        - //例如,通过rate()函数获取HTTP请求量的增长率: rate(http_requests_total[5m])
        - //查询当前系统中,访问量前10的HTTP地址: topk(10, http_requests_total)
    - Gauge:可增可减的仪表盘
        - 与Counter不同,Gauge类型的指标侧重于反应系统的当前状态。因此这类指标的样本数据可增可减。
        - 常见指标如:node_memory_MemFree(主机当前空闲的内容大小)、node_memory_MemAvailable(可用内存大小)都是Gauge类型的监控指标。
        - //通过Gauge指标,用户可以直接查看系统的当前状态:node_memory_MemFree
        - //还可以使用deriv()计算样本的线性回归模型,甚至是直接使用predict_linear()对数据的变化趋势进行预测。
            - 例如,预测系统磁盘空间在4个小时之后的剩余情况:predict_linear(node_filesystem_free{job="node"}[1h], 4 * 3600)
    - Histogram和Summary分析数据分布情况
Instant vector vs Range vector
- https://stackoverflow.com/questions/68223824/prometheus-instant-vector-vs-range-vector
- https://satyanash.net/software/2021/01/04/understanding-prometheus-range-vectors.html
- https://promlabs.com/blog/2020/06/18/the-anatomy-of-a-promql-query/
Rate then sum, never sum then rate
To help keep you on the straight and narrow, remember this:
The only mathematical operations you can safely directly apply to a counter’s values are rate, irate, increase, and resets. Anything else will cause you problems.
The problem of rate()/increase() extrapolation in Prometheus
- https://stackoverflow.com/questions/52697517/prometheus-how-to-rate-a-sum-of-the-same-counter-from-different-machines?rq=3
- https://github.com/prometheus/prometheus/issues/3746
- https://github.com/prometheus/prometheus/issues/3806
- https://github.com/VictoriaMetrics/VictoriaMetrics/issues/1215
- https://docs.google.com/document/d/1y2Mp041_2v0blnKnZk7keCnJZICeK2YWUQuXH_m4DVc/edit?pli=1&tab=t.0#heading=h.bupciudrwmna
- https://lotabout.me/2019/QQA-Why-Prometheus-increase-return-float/ (中文带图)
Aggregating the precomputed quantiles from a summary makes no sense
https://prometheus.io/docs/practices/histograms/#count-and-sum-of-observations avg(http_request_duration_seconds{quantile=“0.95”}) // BAD! histogram_quantile(0.95, sum(rate(http_request_duration_seconds_bucket[5m])) by (le)) // GOOD.
Errors of quantile estimation
https://prometheus.io/docs/practices/histograms/#errors-of-quantile-estimation Quantiles, whether calculated client-side or server-side, are estimated. It is important to understand the errors of that estimation.
Continuing the histogram example from above, imagine your usual request durations are almost all very close to 220ms, or in other words, if you could plot the “true” histogram, you would see a very sharp spike at 220ms. In the Prometheus histogram metric as configured above, almost all observations, and therefore also the 95th percentile, will fall into the bucket labeled {le=“0.3”}, i.e. the bucket from 200ms to 300ms. The histogram implementation guarantees that the true 95th percentile is somewhere between 200ms and 300ms. To return a single value (rather than an interval), it applies linear interpolation, which yields 295ms in this case. The calculated quantile gives you the impression that you are close to breaching the SLO, but in reality, the 95th percentile is a tiny bit above 220ms, a quite comfortable distance to your SLO.
Next step in our thought experiment: A change in backend routing adds a fixed amount of 100ms to all request durations. Now the request duration has its sharp spike at 320ms and almost all observations will fall into the bucket from 300ms to 450ms. The 95th percentile is calculated to be 442.5ms, although the correct value is close to 320ms. While you are only a tiny bit outside of your SLO, the calculated 95th quantile looks much worse.
Best practices
https://grafana.com/docs/grafana/v7.5/best-practices/
Queries Examples
https://prometheus.io/docs/prometheus/2.39/querying/examples/
Prometheus 的各种问题
- http://www.xuyasong.com/?p=1921
- https://aleiwu.com/post/prometheus-bp/
- https://develotters.com/posts/high-cardinality/
高基数问题(High-Cardinality Problem)
2.16 版本以上的 Prometheus 直接支持查看 TSDB 的状态:
Counter 重置导致的问题
Counter 是四种 Metrics 类型中的一种,它的值只会增加(incr)或者重置(reset, 一般是因为实例重启)。
PromQL 的 rate()和increase() 函数会自动处理 Counter 重置的情况,但 sum 不会,所以很多文档都强调一定要先 rate 再 sum,而不能先 sum 再 rate。
rate/increase 是如何处理 counter 重置的?
具体的处理代码为:
|
|
首先遍历样本,如果发现 Counter 减少就认为发生了重置,后续所有样本值都会加上重置前的值。
举个栗子,假设时间序列的值为[5,10,4,6],那么它会被处理为[5,10,14,16]。
Prometheus 报警不准问题
- https://aleiwu.com/post/prometheus-alert-why/ 报警不准,指的是两类问题:
- 『该报』的警没报;
- 『不该报』的警报了; 这里的『该报』和『不该报』都是基于 Grafana 进行判断的。所以这里说报警不准,本质是 Grafana 的仪表盘展示结果和 Prometheus 告警不一致。
这个问题本质是『采样间隔』不一致的:
- Prometheus 的告警器会按固定的时间间隔采样,在一个周期内,如果样本满足告警规则;
- Grafana 渲染图标的结果,则取决于基于 Range Query 采样点的分布;
很可能出现,Prometheus 采样时捕获了『低谷』但 Grafana 忽略了『低谷』导致『不该报』的警报了,或者 Prometheus 忽略了『低谷』而 Grafana 捕获了『低谷』导致『该报』的警没报。
Prometheus: Alertmanager
架构图
为什么要 Alertmanager?
当 Prometheus Server 计算出一些警报后,它自己并没有能力将这些警报通知出去,只能将警报推给 Alertmanager,由 Alertmanager 进行发送。
这个切分,一方面是出于单一职责的考虑,让 Prometheus “do one thing and do it well”, 另一方面则是因为警报发送确实不是一件”简单”的事,需要一个专门的系统来做好它。
可以这么说,Alertmanager 的目标不是简单地”发出警报”,而是”发出高质量的警报”。它提供的高级功能包括但不限于:
- Go Template 渲染警报内容;
- 管理警报的重复提醒时机与消除后消除通知的发送;
- 根据标签定义警报路由,实现警报的优先级、接收人划分,并针对不同的优先级和接收人定制不同的发送策略;
- 将同类型警报打包成一条通知发送出去,降低警报通知的频率;
- 支持静默规则: 用户可以定义一条静默规则,在一段时间内停止发送部分特定的警报,比如已经确认是搜索集群问题,在修复搜索集群时,先静默掉搜索集群相关警报;
- 支持”抑制”规则(Inhibition Rule): 用户可以定义一条”抑制”规则,规定在某种警报发生时,不发送另一种警报,比如在”A 机房网络故障”这条警报发生时,不发送所有”A 机房中的警报”;
Routing Tree
Routing Tree 的设计意图是让用户能够非常自由地给警报归类,然后根据归类后的类别来配置要发送给谁以及怎么发送:
- 发送给谁?上面已经做了很好的示例,’数据库警报’和’前端警报’都有特定的接收组,都没有匹配上那么就是’默认警报’, 发送给默认接收组
- 怎么发送?对于一类警报,有个多个字段来配置发送行为:
- group_by:决定了警报怎么分组,每个 group 只会定时产生一次通知,这就达到了降噪的效果,而不同的警报类别分组方式显然是不一样的,举个例子:
- 配置中的 ‘数据库警报’ 是按 ‘集群’ 和 ‘规则名’ 分组的,这表明对于数据库警报,我们关心的是“哪个集群的哪个规则出问题了”,比如一个时间段内,’华东’集群产生了10条 ‘API响应时间过长’ 警报,- 这些警报就会聚合在一个通知里发出来;
- 配置中的 ‘前端警报’ 是按 ‘产品’ 和 ‘环境’ 分组的, 这表明对于前端警报,我们关心的是“哪个产品的哪个环境出问题了”
- group_interval 和 group_wait: 控制分组的细节,不细谈,其中 group_interval 控制了这个分组最快多久执行一次 Notification Pipeline
- repeat_interval: 假如一个相同的警报一直 FIRING,Alertmanager 并不会一直发送警报,而会等待一段时间,这个等待时间就是 repeat_interval,显然,不同类型警报的发送频率也是不一样的
- group_by:决定了警报怎么分组,每个 group 只会定时产生一次通知,这就达到了降噪的效果,而不同的警报类别分组方式显然是不一样的,举个例子:
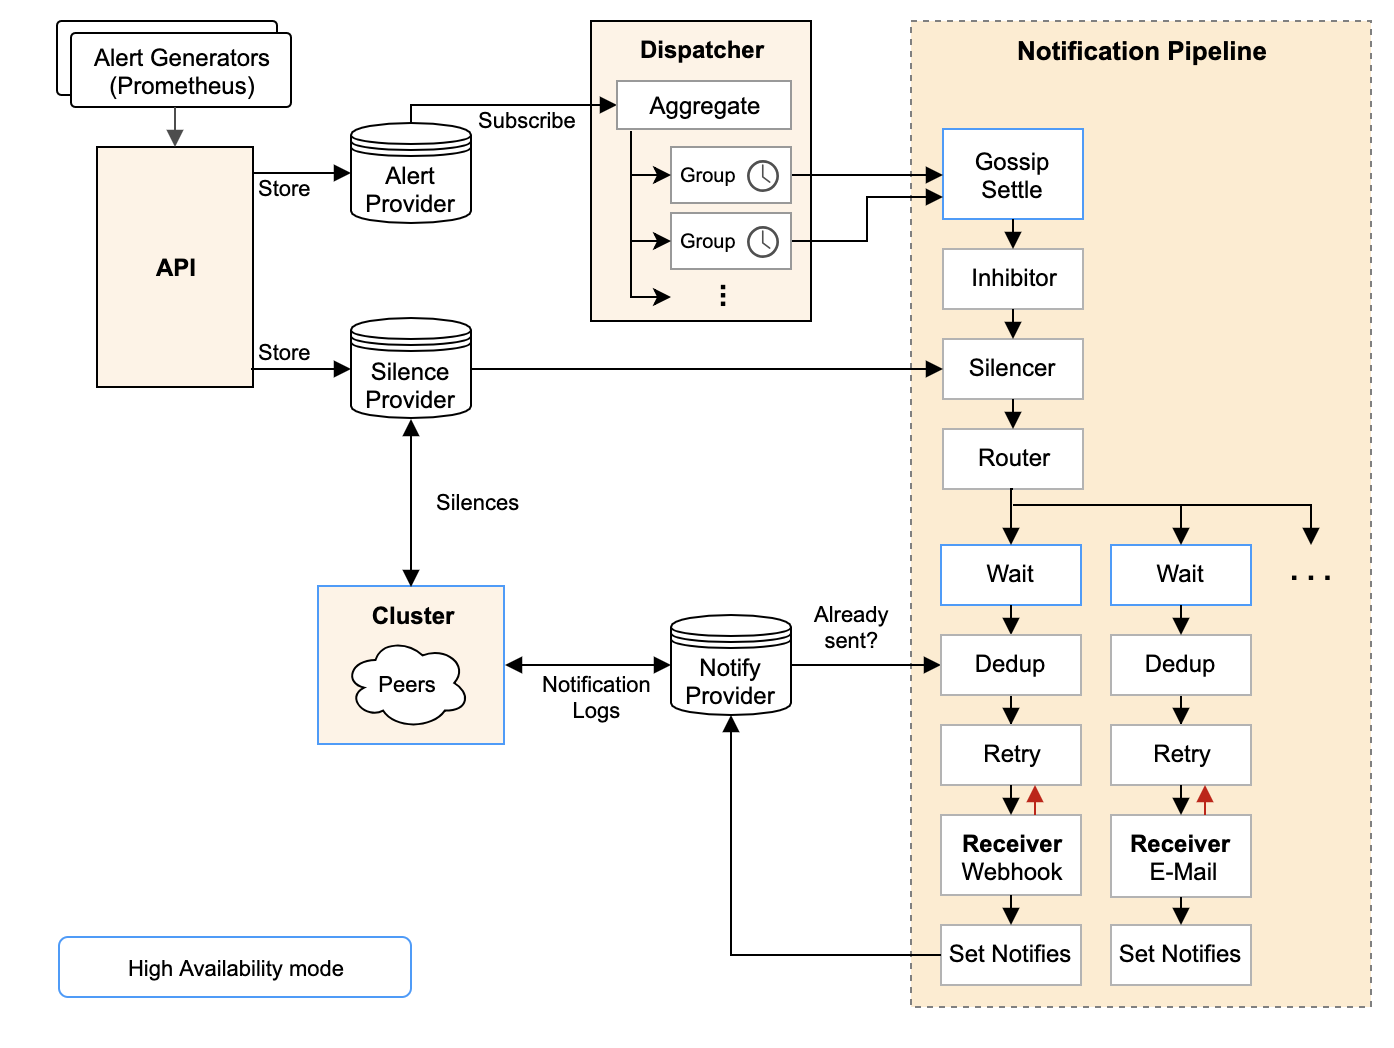
Notification Pipeline
要重点说的是DedupStage和NotifySetStage它俩协同负责去重工作,具体做法是:
- NotifySetStage 会为发送成功的警报记录一条发送通知,key 是’接收组名字’+’GroupKey 的 key 值’,value 是当前 Stage 收到的 []Alert (这个列表和最开始进入 Notification Pipeline 的警报列表有可能是不同的,因为其中有些 Alert 可能在前置 Stage 中已经被过滤掉了)
- DedupStage 中会以’接收组名字’+’GroupKey 的 key 值’为 key 查询通知记录,假如:
- 查询无结果,那么这条通知没发过,为这组警报发送一条通知;
- 查询有结果,那么查询得到已经发送过的一组警报 S,判断当前的这组警报 A 是否为 S 的子集:
- 假如 A 是 S 的子集,那么表明 A 和 S 重复,这时候要根据 repeat_interval 来决定是否再次发送:
- 距离 S 的发送时间已经过去了足够久(repeat_interval),那么我们要再发送一遍;
- 距离 S 的发送时间还没有达到 repeat_interval,那么为了降低警报频率,触发去重逻辑,这次我们就不发了;
- 假如 A 不是 S 的子集,那么 A 和 S 不重复,需要再发送一次; 上面的表述可能有些抽象,最后表现出来的结果是:
- 假如 A 是 S 的子集,那么表明 A 和 S 重复,这时候要根据 repeat_interval 来决定是否再次发送:
- 假如一个 AlertGroup 里的警报一直发生变化,那么虽然每次都是新警报,不会被去重,但是由于 group_interval (假设是5分钟)存在,这个 AlertGroup 最多 5 分钟触发一次 Notification Pipeline,因此最多也只会 5 分钟发送一条通知;
- 假如一个 AlertGroup 里的警报一直不变化,就是那么几条一直 FIRING 着,那么虽然每个 group_interval 都会触发 Notification Pipeline,但是由于 repeate_interval(假设是1小时)存在,因此最多也只会每 1 小时为这个重复的警报发送一条通知; 再说一下 Silence 和 Inhibit,两者都是基于用户主动定义的规则的:
- Silence Rule:静默规则用来关闭掉部分警报的通知,比如某个性能问题已经修复了,但需要排期上线,那么在上线前就可以把对应的警报静默掉来减少噪音;
- Inhibit Rule:抑制规则用于在某类警报发生时,抑制掉另一类警报,比如某个机房宕机了,那么会影响所有上层服务,产生级联的警报洪流,反而会掩盖掉根本原因,这时候抑制规则就有用了; 因此 Notification Pipeline 的设计意图就很明确了:通过一系列逻辑(如抑制、静默、去重)来获得更高的警报质量,由于警报质量的维度很多(剔除重复、类似的警报,静默暂时无用的警报,抑制级联警报),因此 Notification Pipeline 设计成了责任链模式,以便于随时添加新的环节来优化警报质量
Prometheus存储机制
深入 PromQL
Bascis
- https://stackoverflow.com/questions/68223824/prometheus-instant-vector-vs-range-vector
- https://satyanash.net/software/2021/01/04/understanding-prometheus-range-vectors.html
- https://promlabs.com/blog/2020/06/18/the-anatomy-of-a-promql-query/
- Prometheus Querying - Breaking Down PromQL
Functions
Rate & Increase
- https://promlabs.com/blog/2021/01/29/how-exactly-does-promql-calculate-rates/
- https://stackoverflow.com/questions/54494394/do-i-understand-prometheuss-rate-vs-increase-functions-correctly?rq=3
- https://stackoverflow.com/questions/48218950/increase-in-prometheus-sometimes-doubles-values-how-to-avoid?rq=3
- https://stackoverflow.com/questions/52697517/prometheus-how-to-rate-a-sum-of-the-same-counter-from-different-machines
- https://github.com/VictoriaMetrics/VictoriaMetrics/issues/1215
- https://stackoverflow.com/questions/70835778/understanding-increase-and-rate-used-on-http-server-requests-seconds-count-w
由于 prometheus 使用了线性插值算法取计算 increase(增量),所以计算结果会得到小数,这一点特别容易让人误解。
|
|
histogramQuantitle
用法示例:
|
|
源码见:
- https://github.com/prometheus/prometheus/blob/caa173d2aac4c390546b1f78302104b1ccae0878/promql/functions.go#L615
- https://github.com/prometheus/prometheus/blob/caa173d2aac4c390546b1f78302104b1ccae0878/promql/quantile.go#L73 核心算法是:bucketStart + (bucketEnd-bucketStart)*(rank/count)。
同样也是线性插值算法,比较好理解。唯一需要注意的是,在 histogram_quantile 的第二个参数是 sum(rate, …),这个是 QPS(count/time) 而不是直接用的 count,为什么?计算公式里最后一项是 rank/count,而 rank = q*count,两者相除 time 项会被消除,相当于还是 count’ / count,也就是结果是等价的。既然结果等价,为什么要用 rate 而不直接用 count?因为 rate 函数可以使用处理 reset,直接用 count 不行。
|
|
相关资料
- https://stackoverflow.com/questions/55162093/understanding-histogram-quantile-based-on-rate-in-prometheus
- https://stackoverflow.com/questions/60962520/how-to-get-the-quantile-of-rate-in-prometheus/65418483#65418483
可以在 prometheus 项目下执行下面的单测:
|
|